
Multi-site visibility for civil & infra contractors

Your sites
aren’t islands.

Outsite gives scattered, linear works one live view: every crew, machine and material — across every site, in real time. Field reports in seconds. Planned-vs-actual on every site, every day.

Built by a former site engineer Live on Singapore roadworks today
outsites.app
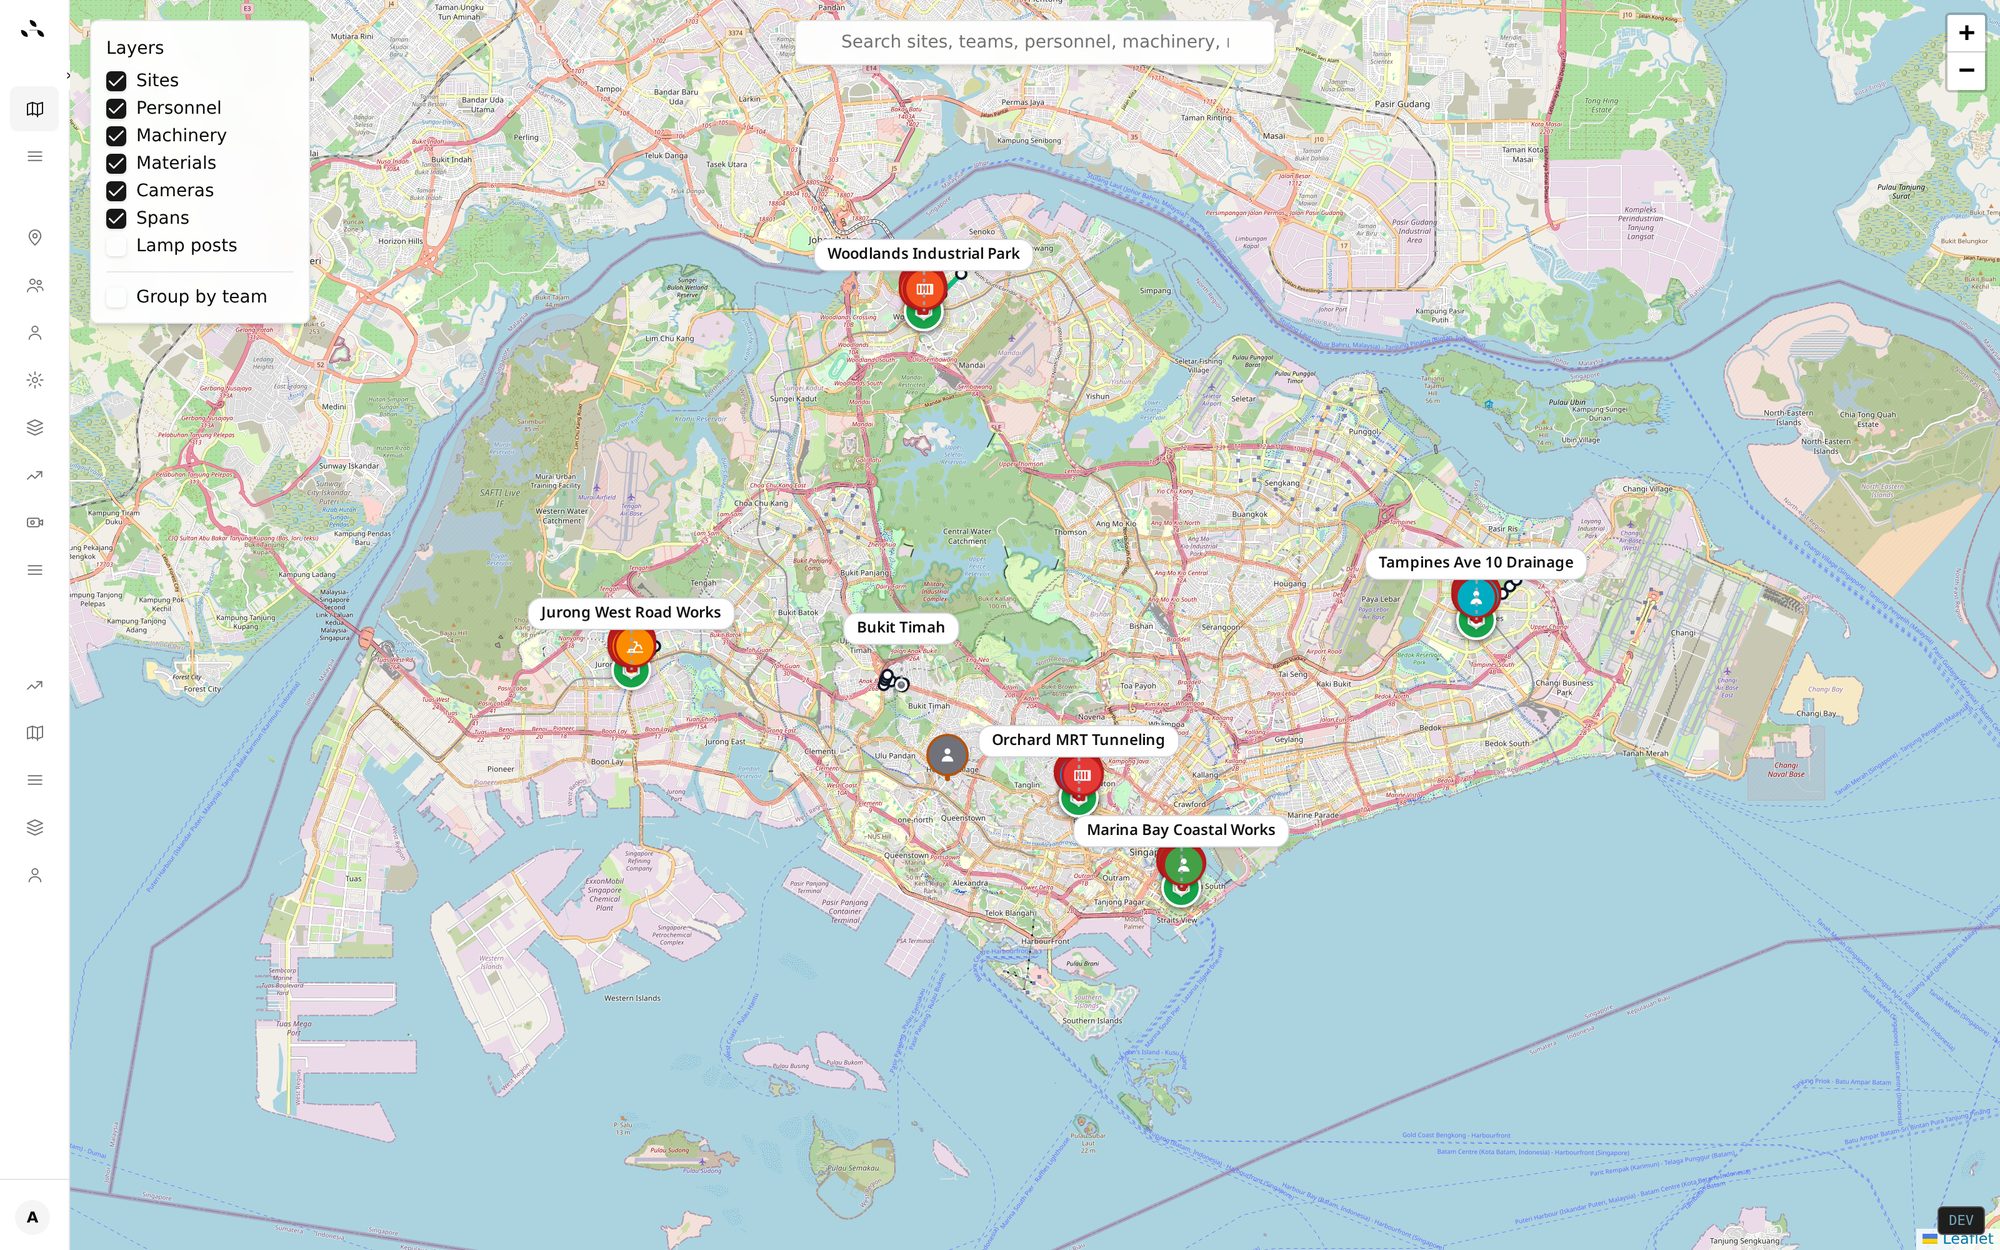
Outsite live map showing six concurrent sites across Singapore with team-coloured crew and machinery markers.

The problem

Buried in WhatsApp, spreadsheets and PDFs.

Every hour chasing data is margin leaking out of the job.

The product

One live view of every site.

Outsite is a multi-site visibility platform built for scattered, linear works — not single building sites. Six features doing the work of a spreadsheet stack.

01 · Live map

Every crew, machine and material — live, on one map.

Real GPS positions from Telegram and CCTV. Group by site, team or work-type. Hover any marker for last-seen time, current task, and the team it belongs to.

/
Map view with six Singapore sites and crew markers

02 · Daily reports

Field reports in seconds, from Telegram.

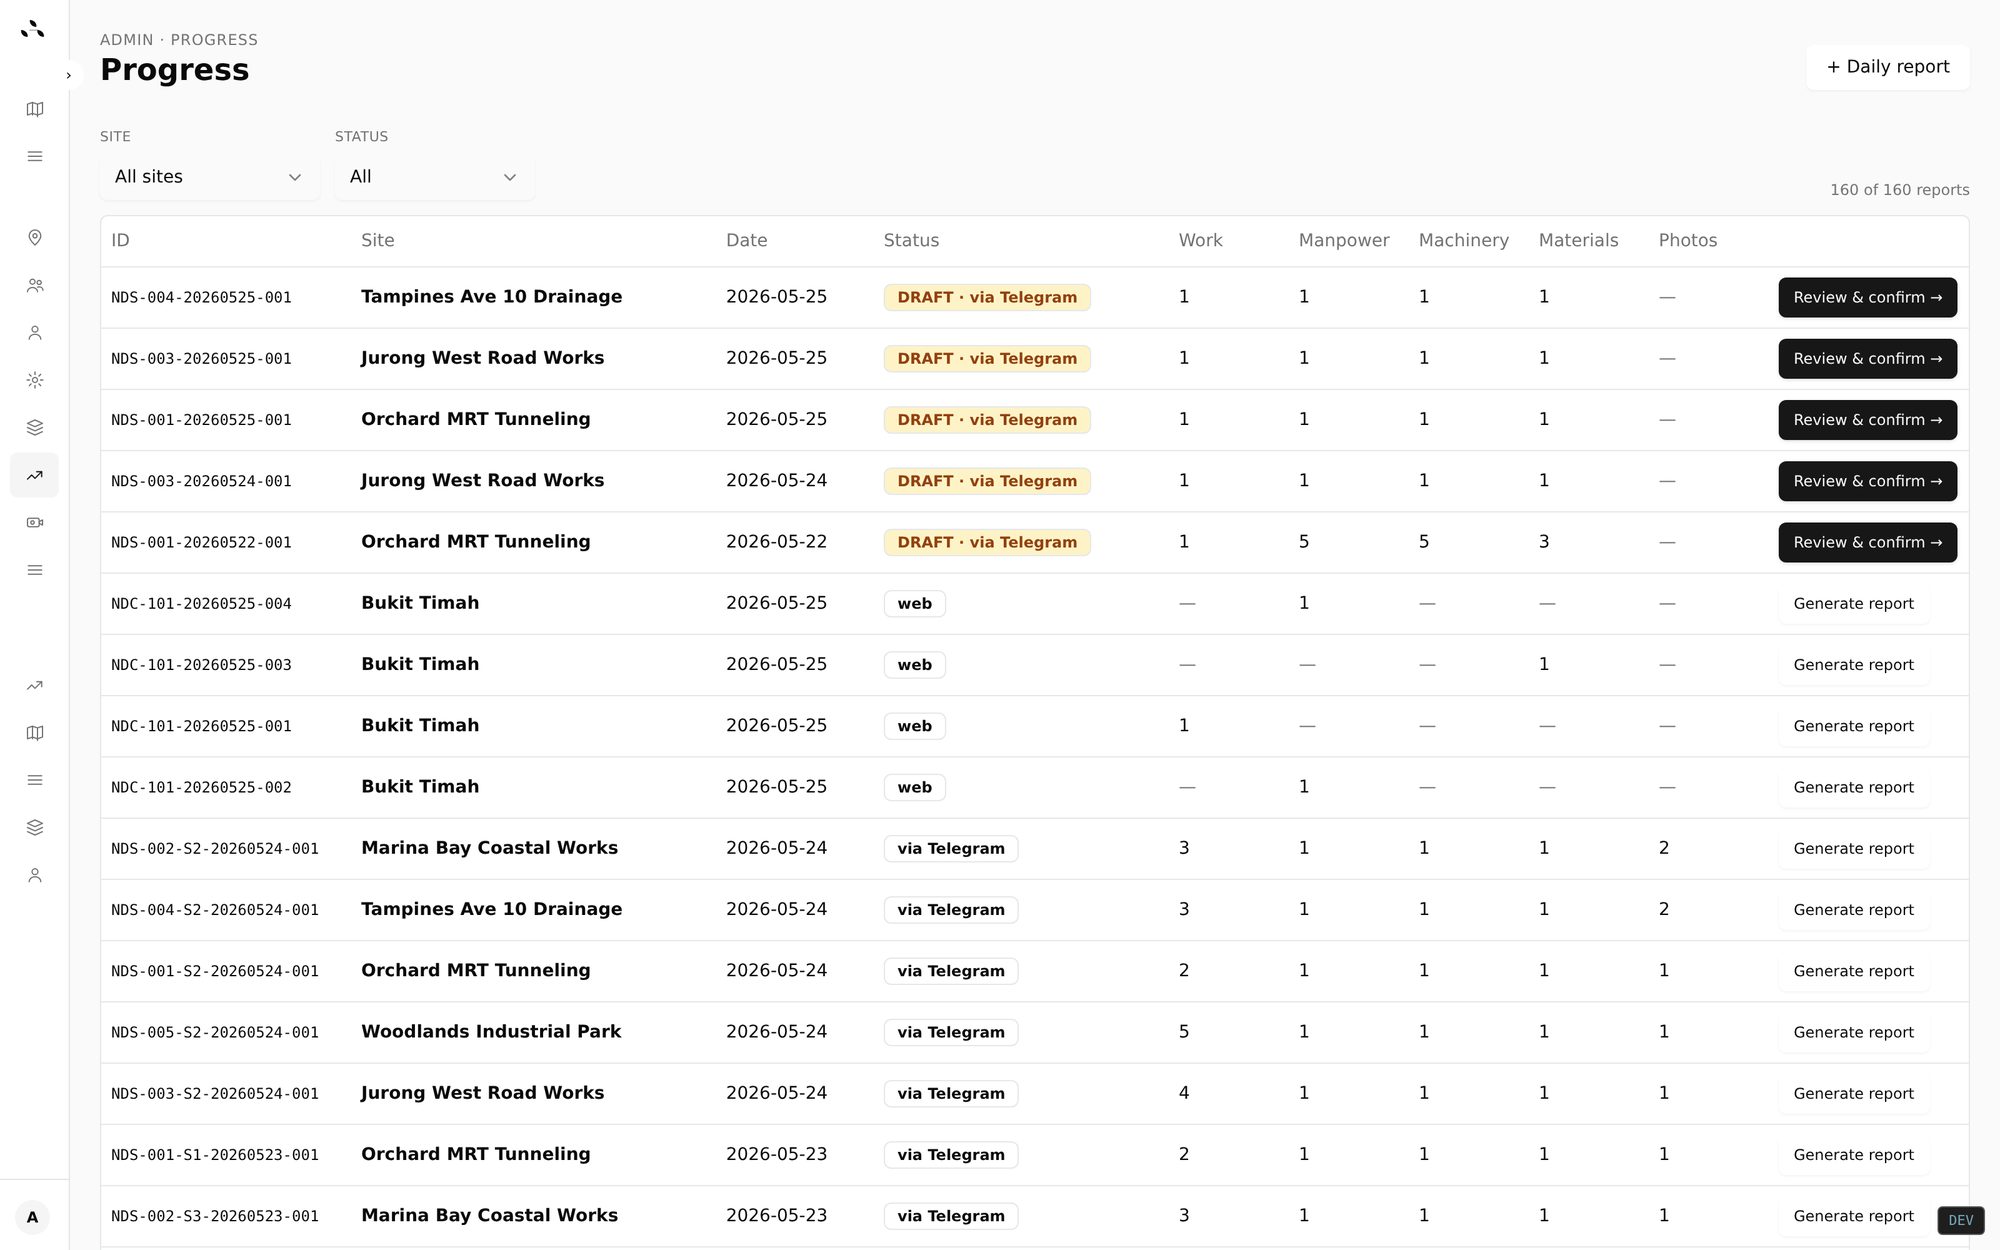
Site supervisors send the daily report straight from the field. Outsite parses manpower, machinery, materials & work done — and stages every draft for office review.

/admin/progress
Daily reports list with Telegram-sourced drafts and review-and-confirm actions

03 · Margin watch

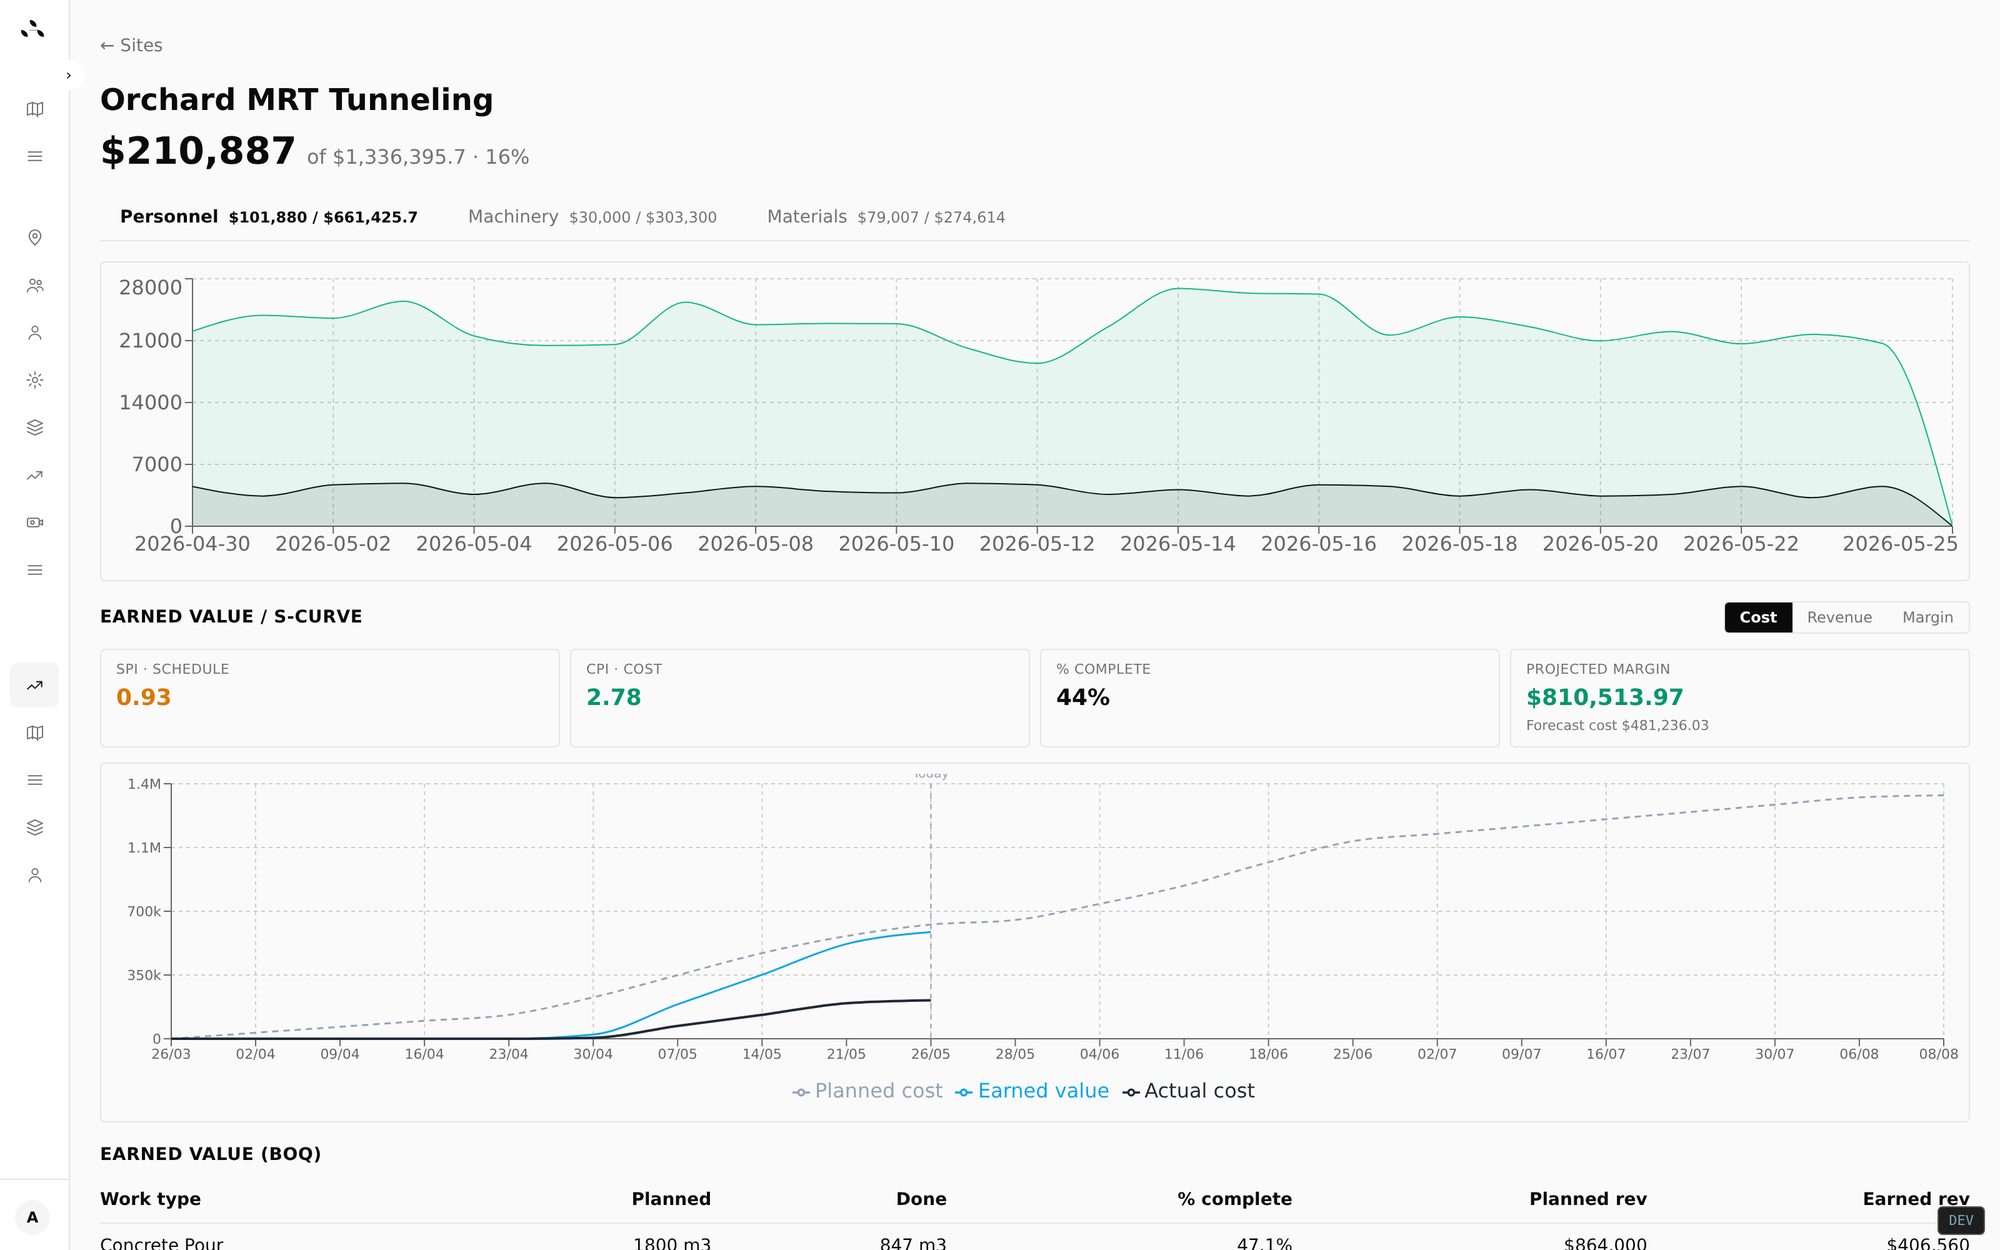
Earned-value S-curve on every project.

Planned vs earned vs actual — with live SPI, CPI and a forward projected margin on every site. Variance shows up the day it happens, not at month end.

/finance/site/…
Earned-value S-curve dashboard for one site with SPI, CPI, % complete and projected margin chips above a planned-vs-earned-vs-actual chart

04 · Span tracking

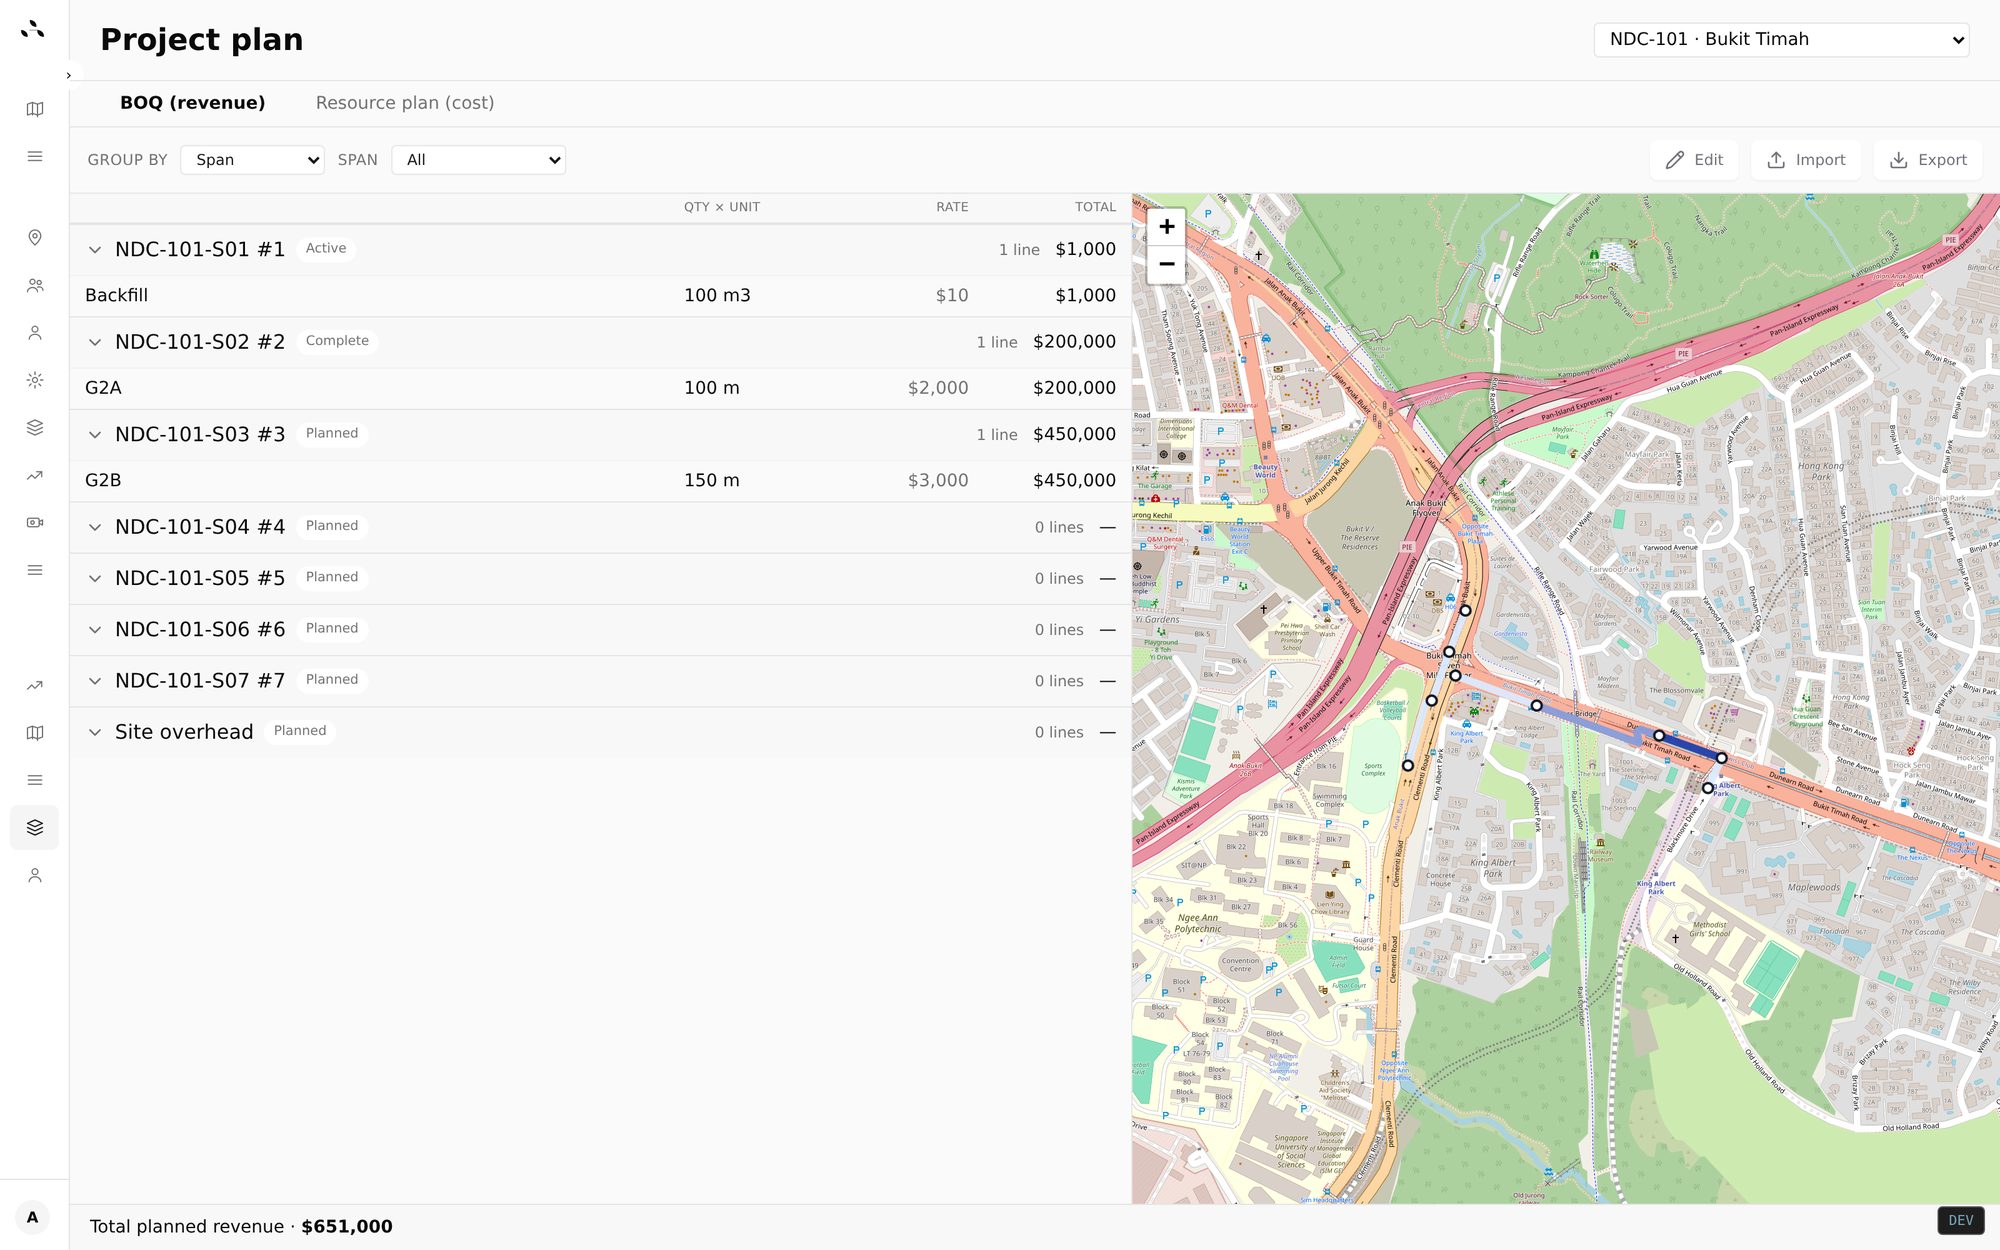
Linear works, broken into chainages you can actually plan against.

Draw spans on the map. Plan revenue and resources per chainage. The same span powers the daily report, the BOQ and the live map — one source of truth.

/finance/budgets
Project plan editor with BOQ revenue lines side-by-side with the chainage map

05 · Progress map

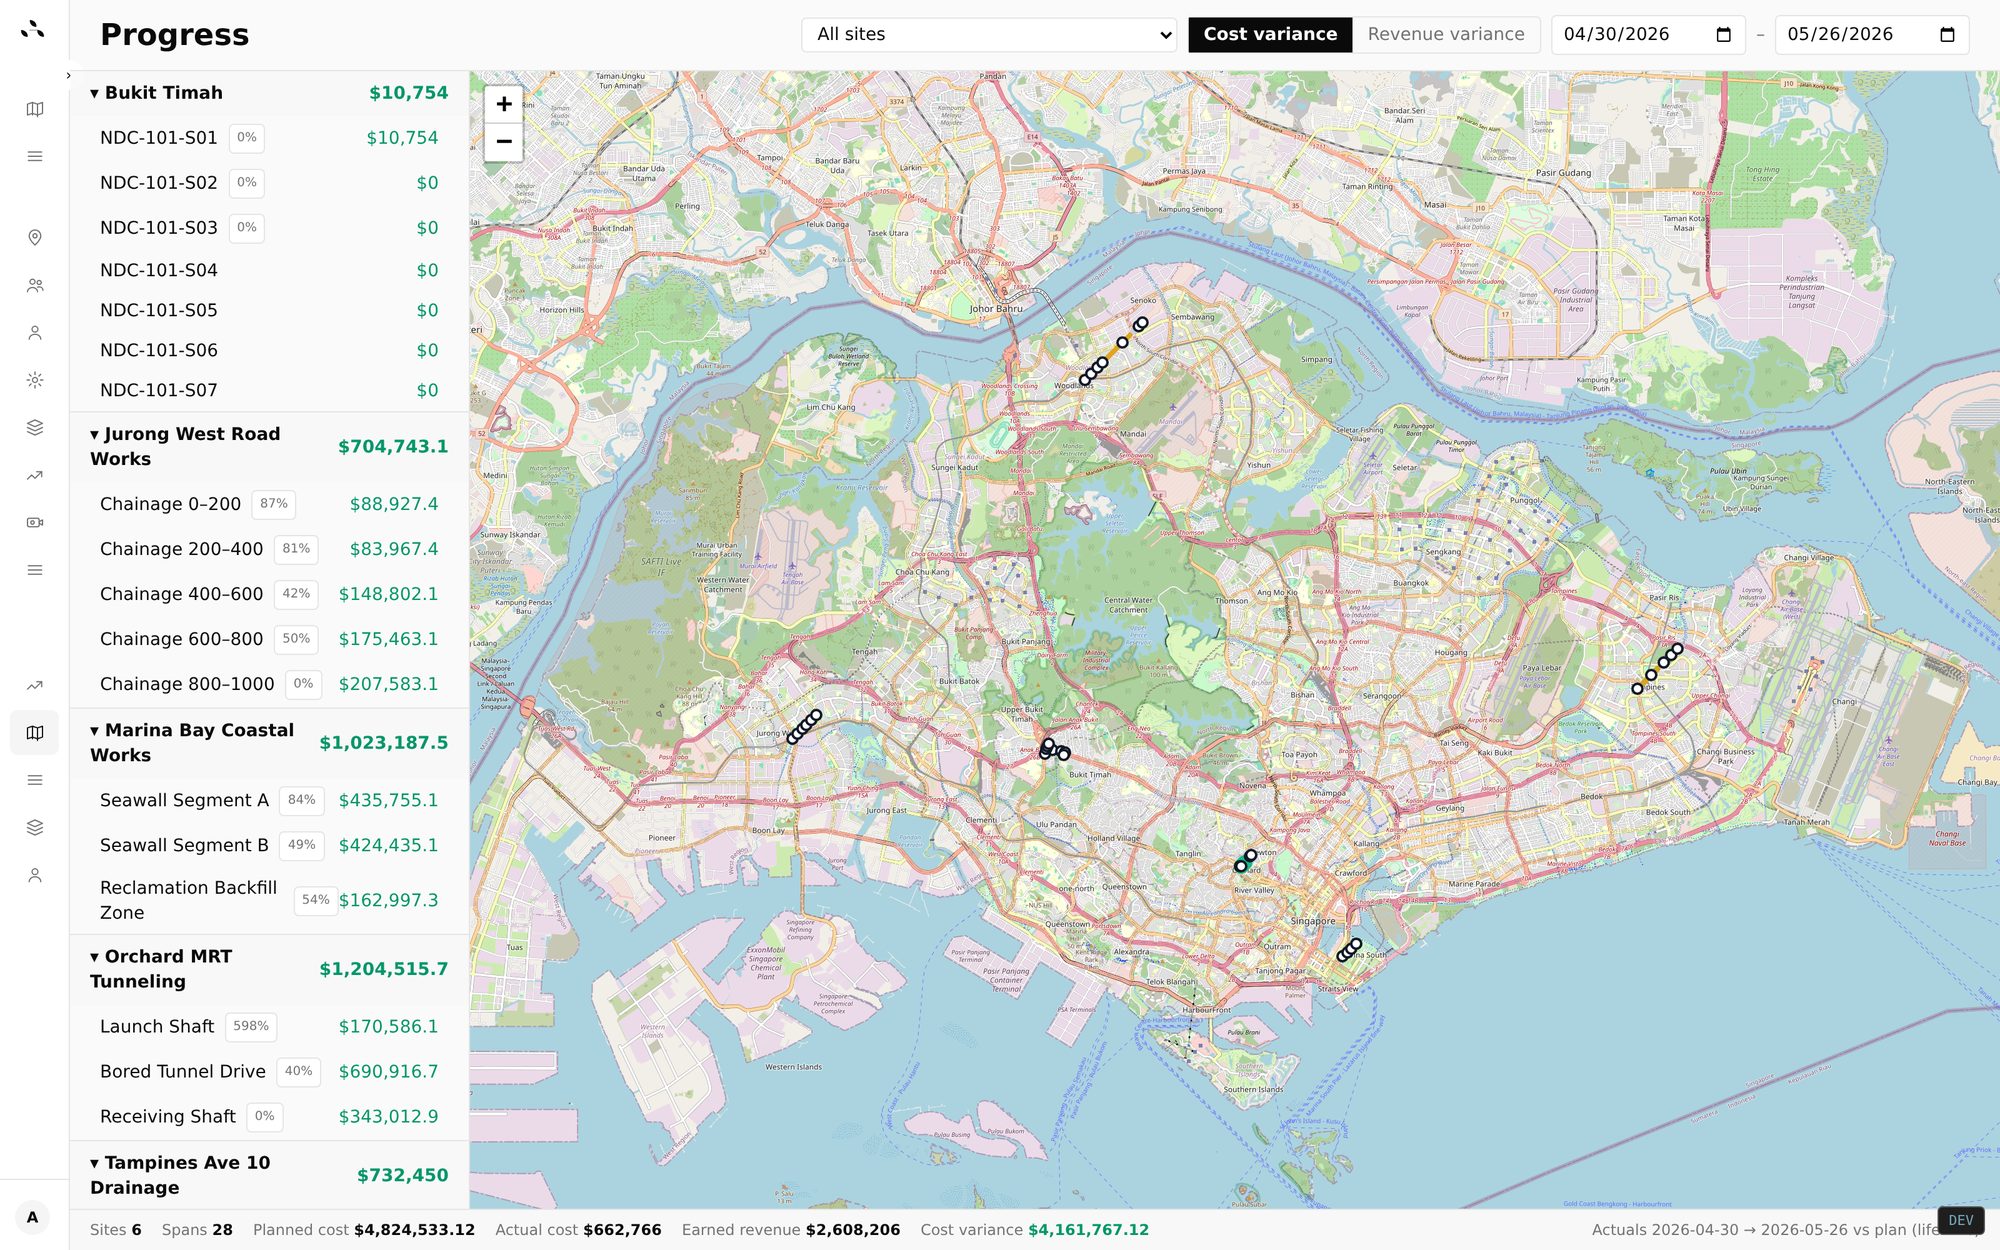
Portfolio-wide variance at a glance.

Earned-value rolled up across every span and every site — coloured by variance, weighted by planned revenue.

/finance/progress
Portfolio progress map with chainage-level variance overlay across all Singapore sites

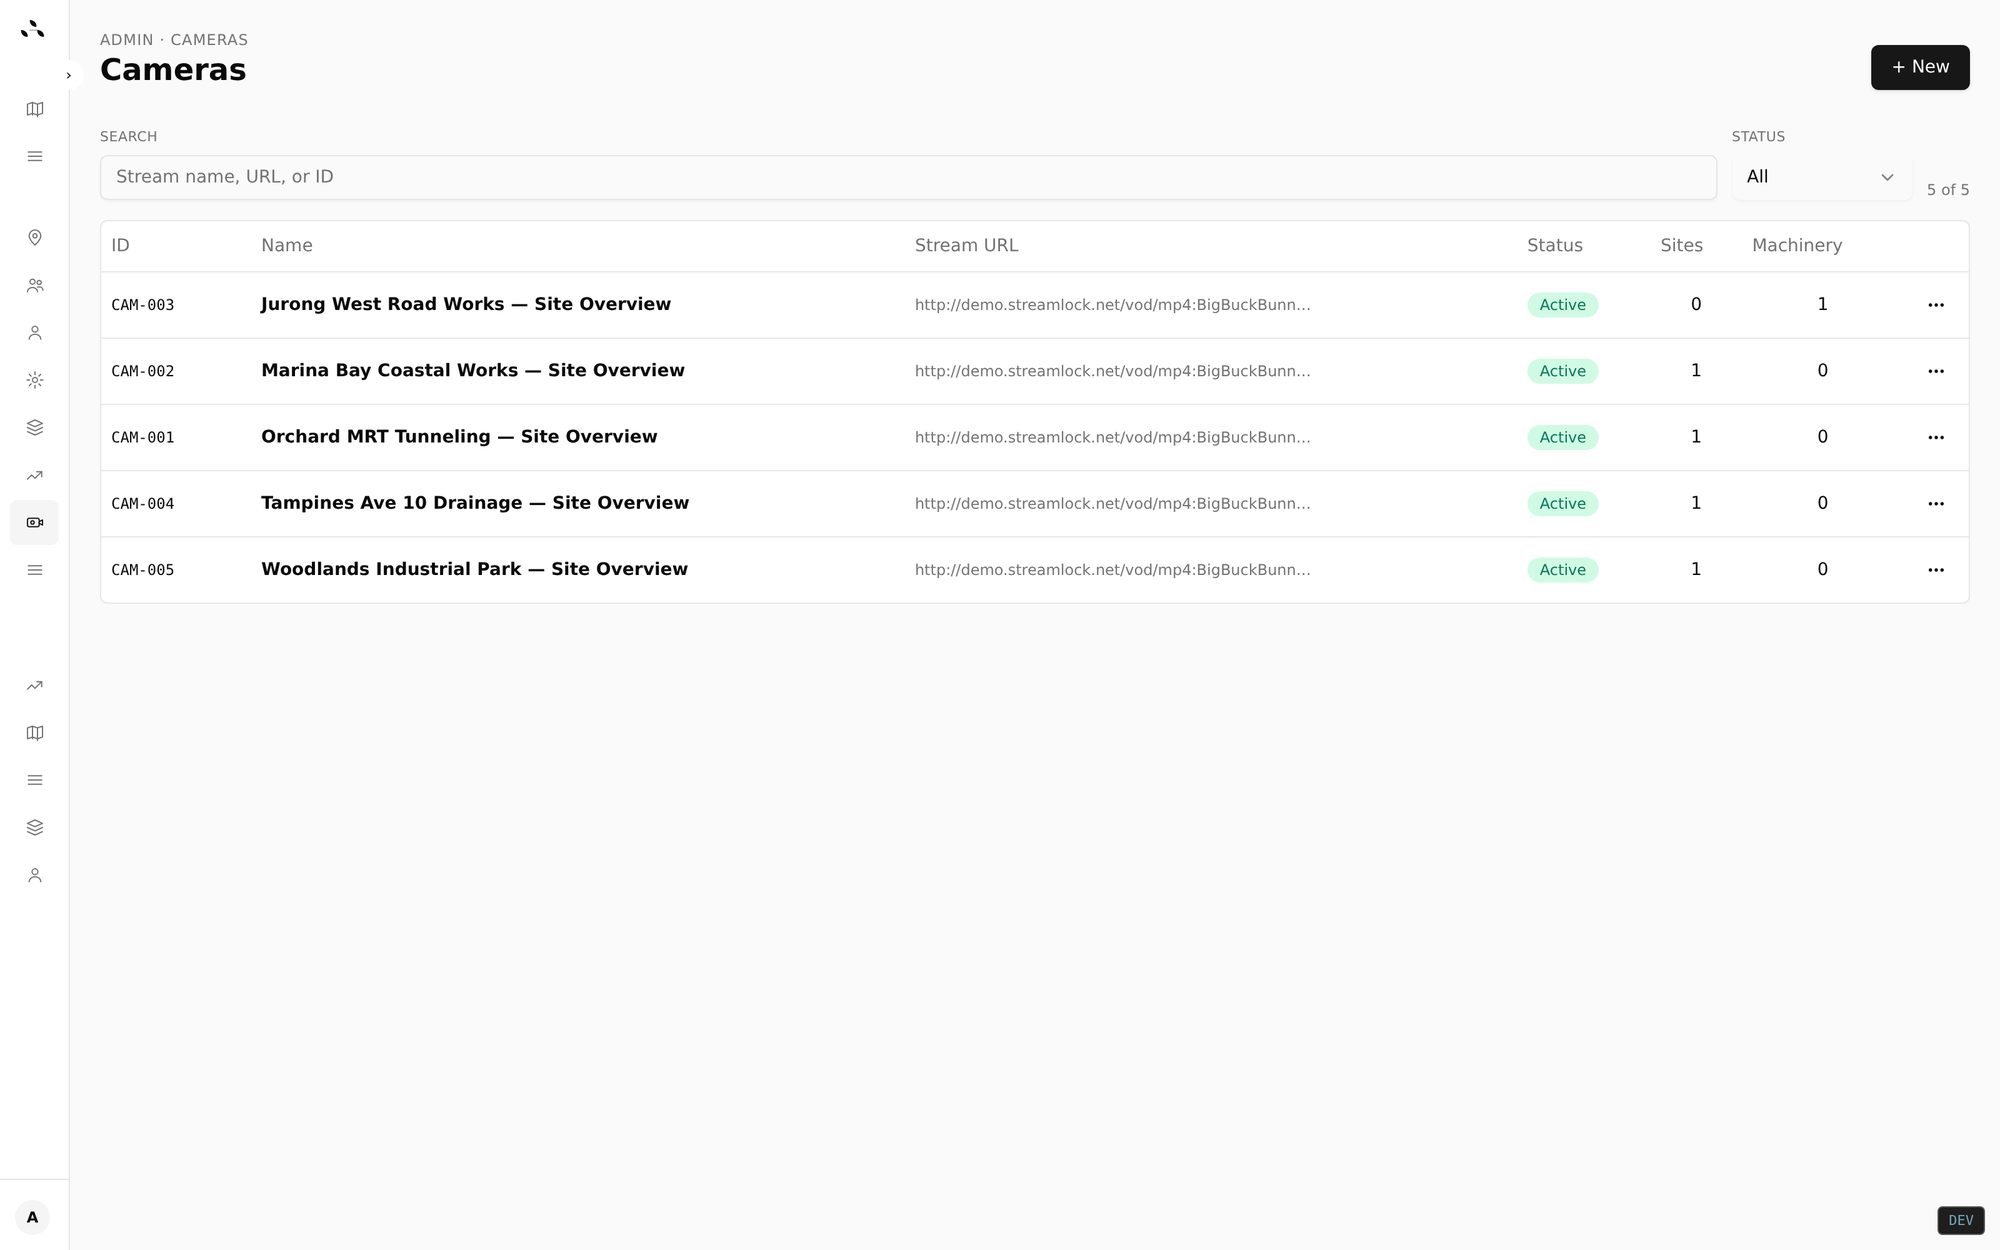
06 · Safety AI

Cameras that flag unsafe acts on site.

A state-of-the-art bespoke model watches active site cameras for unsafe acts and near-misses — auto-alerts to Telegram with an annotated photo.

/admin/cctv
CCTV streams admin table with active streams attached to each Singapore site

How it works

Three moving parts. One live system.

  1. Step 01

    Plan once, in the office.

    Draw your spans on the map, drop in the BOQ, and Outsite turns it into a live plan — costs, revenue and resources per chainage.

  2. Step 02

    The field reports itself.

    Crews send the daily report from Telegram — manpower, machinery, materials, photos, work done. Outsite parses it and stages a draft for confirmation.

  3. Step 03

    The office sees everything.

    Live map updates the moment a crew checks in. Margin updates the moment a report is confirmed. No spreadsheets to reconcile.

Stop chasing the field.
Start seeing it.

A 20-minute demo using your own site list. No slides. No sales call. Just the product, the map, and your data.